
Industry :
Industry: Retail
The Challenge
- Fragmented sales data: Sales, product, customer, and regional data were spread across several systems (POS, inventory, CRM), making integrated analysis difficult.
- Slow report turnaround: Business users had to wait for periodic static reports to understand performance; real-time or near-real-time insights were lacking.
- Lack of product & regional visibility: Hard to spot which products are under-performing, which regions or stores are lagging, or how sales are trending over time.
- Difficulty in monitoring profitability: Margins, discount impacts, cost of goods sold, and returns were not visible in the same view, making profitability analysis cumbersome.
- Limited interactivity: Reports were largely static; users could not drill down, filter dynamically, or compare scenarios effectively.
Scope of Project
The project aimed to develop a comprehensive, interactive retail analytics dashboard (the “SuperStore Dashboard”) that would:
- Bring together data from multiple sources (sales, inventory, customers, returns, channels) into one unified view.
- Provide real-time or near real-time insights into sales trends, product performance by category, regional/store comparisons, customer segments, and profit margins.
- Offer interactive features including filtering, drill downs (e.g., by product, region, time), top/bottom product lists, trend lines.
- Enable business users (store managers, merchandisers, senior management) to monitor KPIs such as sales growth, average order value, discount performance, returns rate, inventory turnover.
- Provide visual tools to analyze promotions, seasonal effects, product category performance, channel contributions etc.
Solution Provided
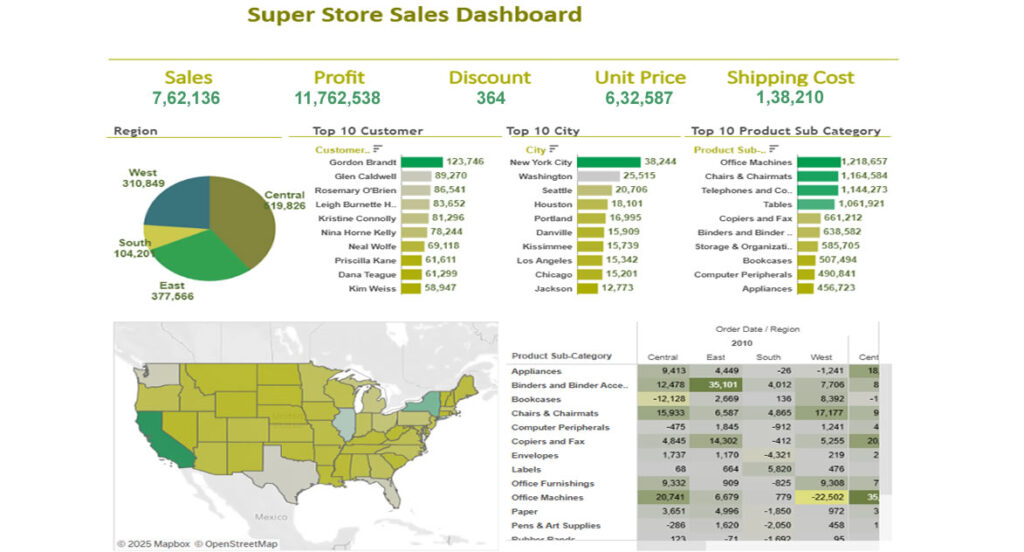
- Designed and built a Tableau Dashboard (“SuperStore Dashboard”) combining multiple views:
- Sales over Time: Trend lines and month-by-month comparisons.
- Region/Store Performance: Maps or bar charts comparing performance across geography.
- Product & Category Analysis: Top selling products, margin by category, discount impact.
- Customer Segmentation: Repeat vs new customers, average purchase size.
- Returns & Profitability: Return rates and margin erosion by discount or product type.
- Data integration setup:
- Combined data from POS, inventory, return systems, CRM.
- Data cleaning & transformation to standardize product/category naming, handle missing values etc.
- Dashboard interactivity:
- Filters (region, product category, time period).
- Drill down features (e.g. store → city → region).
- Parameter controls for user-selected scenarios (e.g. comparing periods, applying discount thresholds).
- Performance optimization:
- Some pre-aggregated tables / extracts for faster loading.
- Using incremental refreshes where possible.
- Deployment & sharing:
- Published dashboards to Tableau Server / Tableau Public for widest access.
- Role-based access: store managers vs regional managers vs senior executives.
Business Impect
| Area | Results / Improvements |
| Speed of Insights | Reports that used to take days to generate are now available in real time or near-real time, enabling faster decision-making. |
| Product & Regional Visibility | Under-performing products and regions are identified sooner; corrective actions (promotions, stock reallocation) implemented faster. |
| Profitability Awareness | Better visibility into discounts, returns, and cost structure improved margin management. |
| Enhanced Sales Performance | Increased sales growth through better alignment of inventory with demand, promotion effectiveness, and identifying high potential products. |
| Operational Efficiency | Reduced manual effort in reporting; fewer ad-hoc requests for data; dashboard reuse lowered load on data teams. |
| User Engagement & Decision Support | Business users (store/regional/senior management) adopted dashboard as a “single source of truth”; used daily to inform strategy. |
Tools & Technology Environment
- Visualization & BI Tool: Tableau Desktop, Tableau Server / Tableau Public
- Data Sources: POS (point of sale) systems, inventory management systems, CRM, returns data, product master data
- Data Preparation / ETL: Data cleaning, transformation (product names, categories, returns data), standardizing time periods etc. Possibly SQL / database extracts or data warehouses
- Performance Optimizations: Data extracts / aggregations, incremental refresh, optimized filters and parameter use
- User Access / Security: Role-based permissions, sharing via dashboards (server / public or private), filters at user level